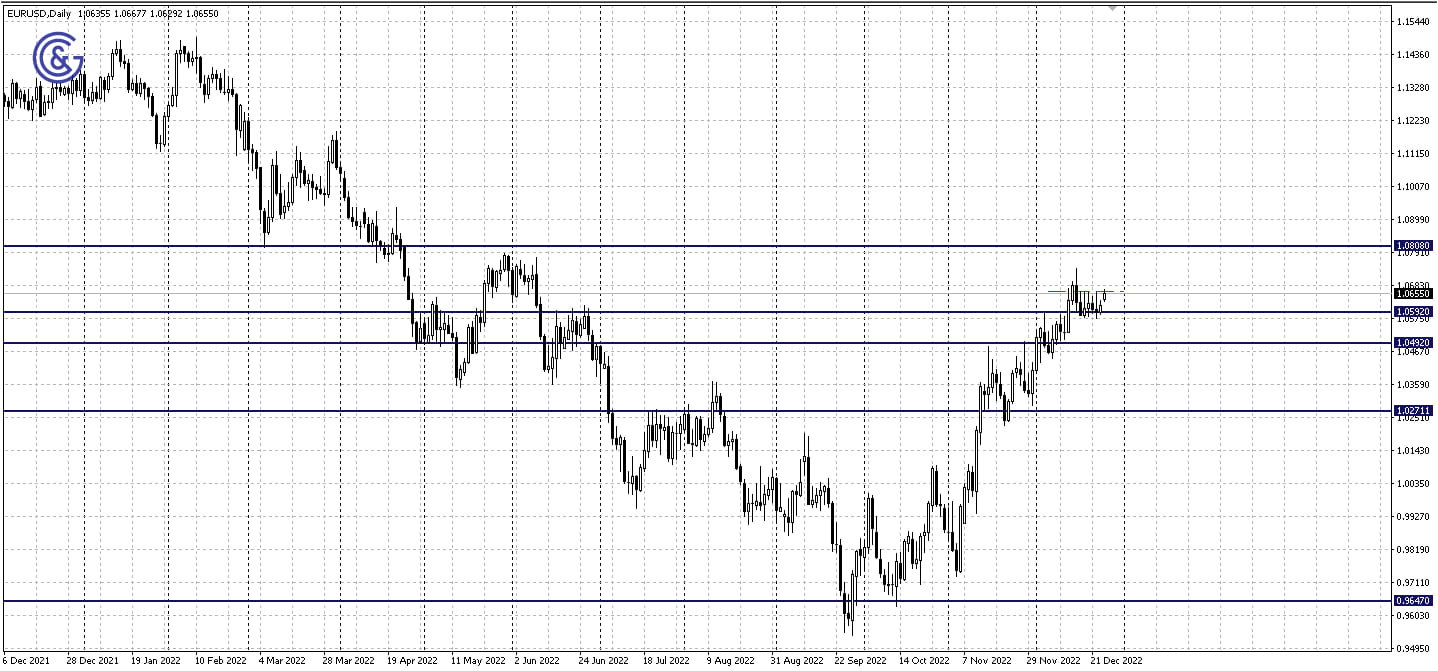

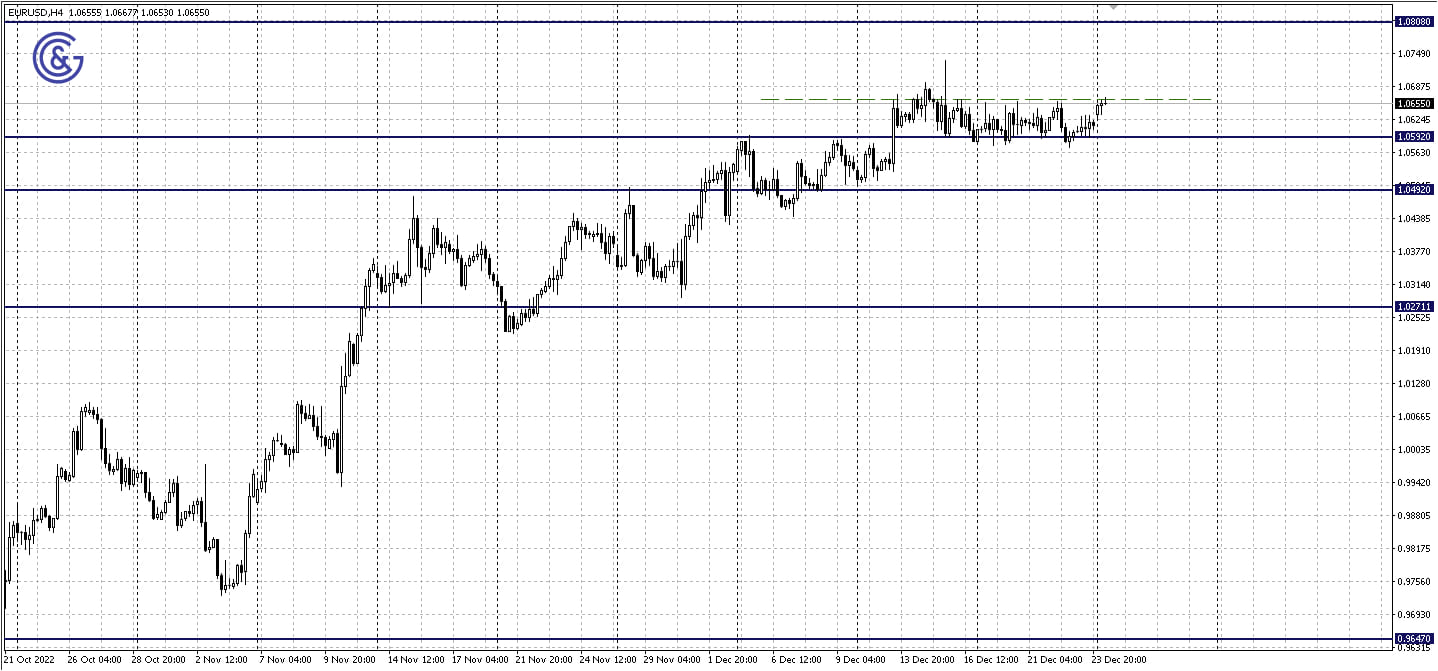
As the U.S. dollar is growing weaker, the EUR/USD increased on Tuesday. This, however, did not affect the ethnic pattern of consolidation, leaving room for the price to move beyond the limits of the horizontal trend against the backdrop of an increase in market liquidity and volatility.
From a technical perspective, there have been no major changes on the EUR/USD daily chart since last week. The 1.0592 support level remains the lower boundary of consolidation while the resistance level passes along the last week’s extrema.
The news background of Tuesday's trading session will be quite scarce. Generally speaking, the trades are likely to remain moderate until the end of the week since there are no significant news drivers at the moment. In addition, large capital has left the market.
That being said, it makes sense to keep an eye on the stats listed below, as the local discrepancy between the expected and actual figures may trigger a volatility spike of the U.S. dollar in the pair. These are the figures that will be released in the coming days.
The Pending Home Sales Index (PHS) in the U.S. real estate market with data for the month of November will be released on Wednesday, at 3:00 PM GMT. Month-on-month, the figures are projected at -1.0% as compared to -4.6% earlier.
The Initial Jobless Claims in the United States will be published on Thursday at 1:30 PM GMT. The figures are expected to increase from 216 thousand to 225 thousand a week earlier.

Against the backdrop of the declining U.S. dollar, the GBP/USD pair has slightly increased today. The U.S. currency has been under pressure due to the improved risk appetite in the market.
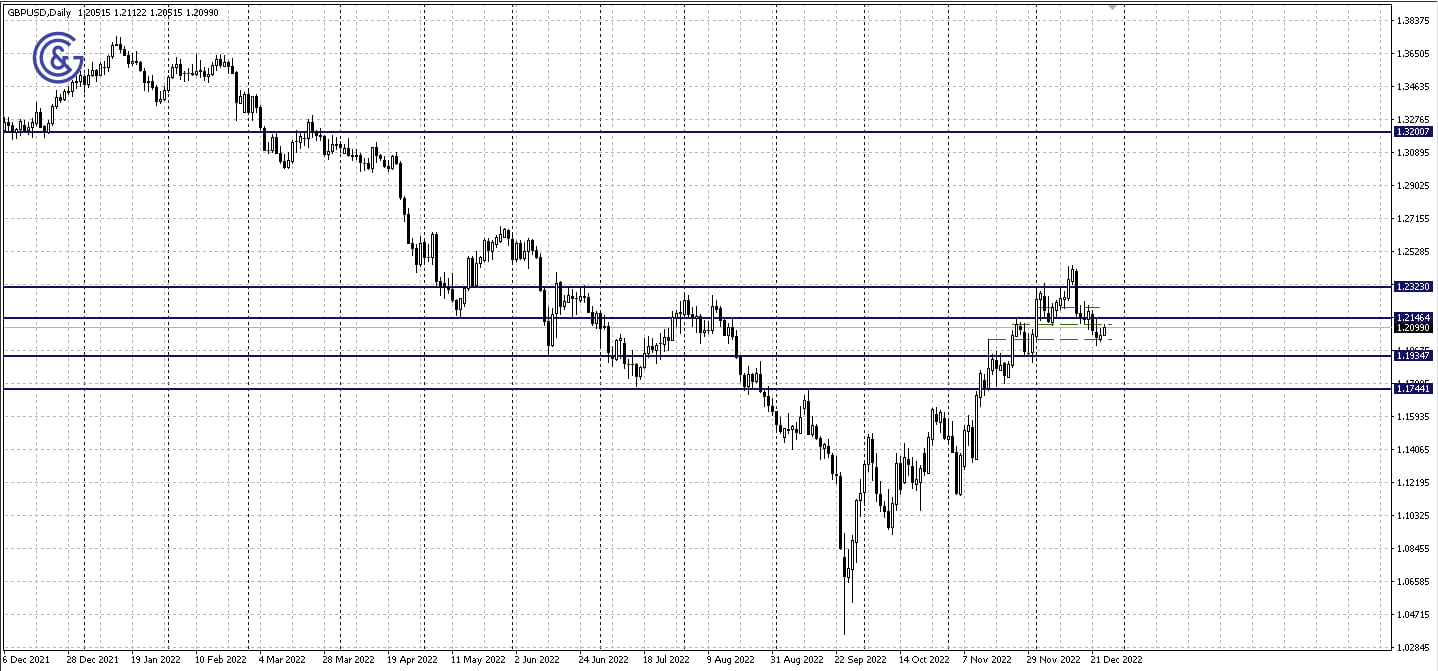
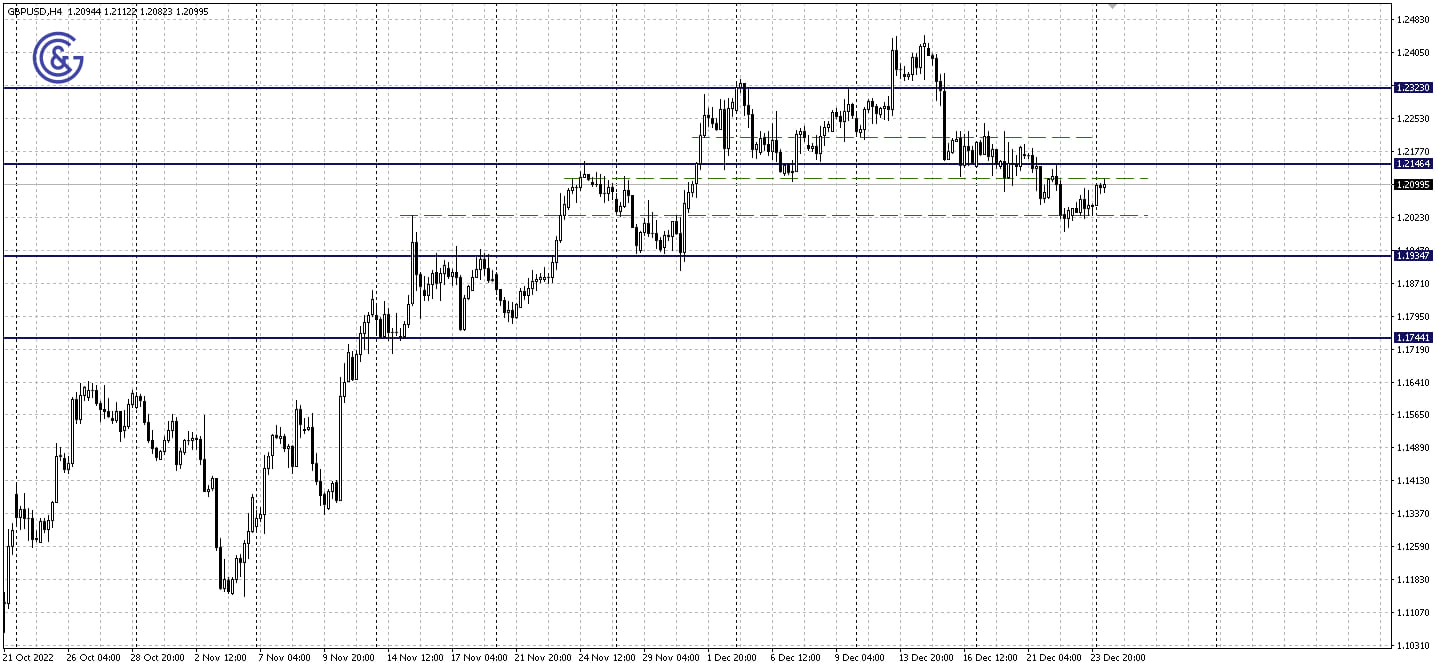
On the daily chart, we can see that the price remains within the 1.1934 - 1.2146 sideways range. From a technical perspective, there is sufficient movement range to each of the corridor boundaries. If the 1.2146 level is reached, a decline seems more likely than a breakout of this level and consolidation above it.
The United Kingdom continues to enjoy the long Christmas weekend today. And even though no major events that may cause a volatility spike are expected before the end of the year, the dollar’s reaction to a few upcoming macroeconomic data releases may still have a local impact on the currency pair’s volatility.
The Pending Home Sales Index (PHS) in the U.S. real estate market with data for the month of November will be released on Wednesday, at 3:00 PM GMT. Month-on-month, the figures are projected at -1.0% as compared to -4.6% earlier.
The Initial Jobless Claims in the United States will be published on Thursday at 1:30 PM GMT. The figures are expected to increase from 216 thousand to 225 thousand a week earlier.
On the 4H chart, the GBP/USD pair keeps trading within 1.2028 - 1.2112 which is a narrow sideways range marked with green dotted lines. The price is reversing into a downward trend from its resistance and has enough range to move toward support.
As the Australian dollar went up against the backdrop of improved risk sentiment after China’s decision to scrap the COVID-19 quarantine rule for inbound travelers, the U.S. dollar remained under pressure on Tuesday.
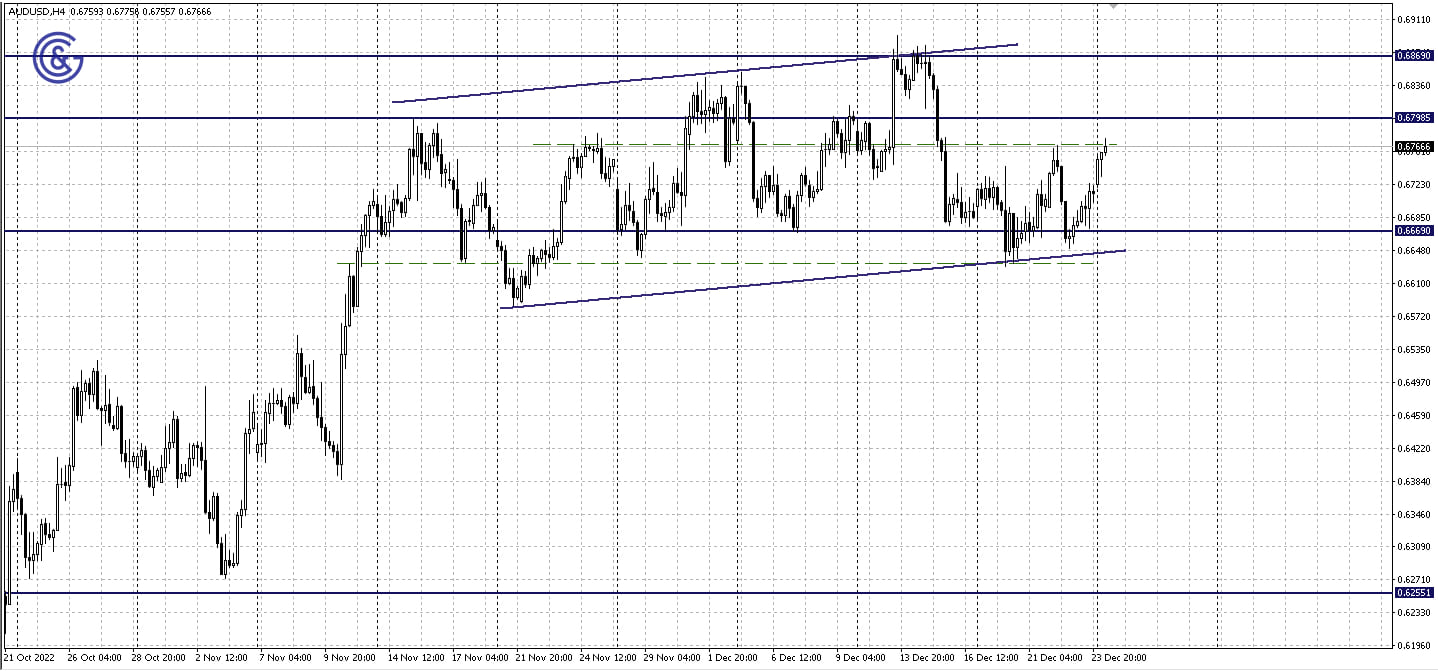
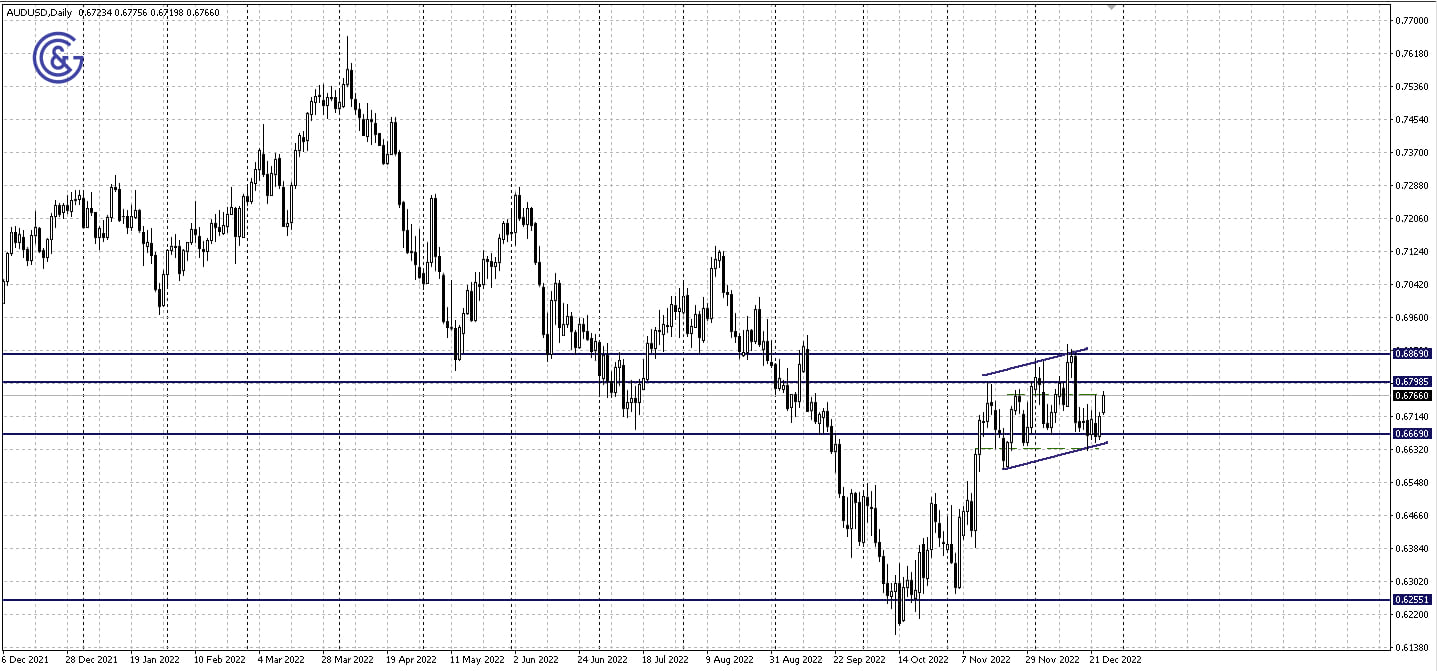
On the daily AUD/USD chart, we can see the price moving in an uptrend while it approaches the 0.6669 - 0.6798 resistance of the sideways range. If quotes manage to reach its resistance and overcome this level, 0.6869 will become the next growth target.
The last week of the year will be marked by limited news background and low liquidity in the market. That being said, we are expecting a release of the Pending Home Sales Index (PHS) in the U.S. real estate market for the month of November on Wednesday, at 3:00 PM GMT. This may have a local impact on the dynamics of the U.S. currency in the pair especially if the actual figures do not match the expected ones. Month-on-month, the figures are projected at -1.0% as compared to -4.6% earlier.
The Initial Jobless Claims in the United States will be published on Thursday at 1:30 PM GMT. The figures are expected to increase from 216 thousand to 225 thousand a week earlier.
On the 4H chart of AUD/USD, 0.6868 which is an intermediate intraday level marked with dotted lines has stopped the price increase for the second time. If the price fails to overcome it, it may return to the 0.6690 support.
